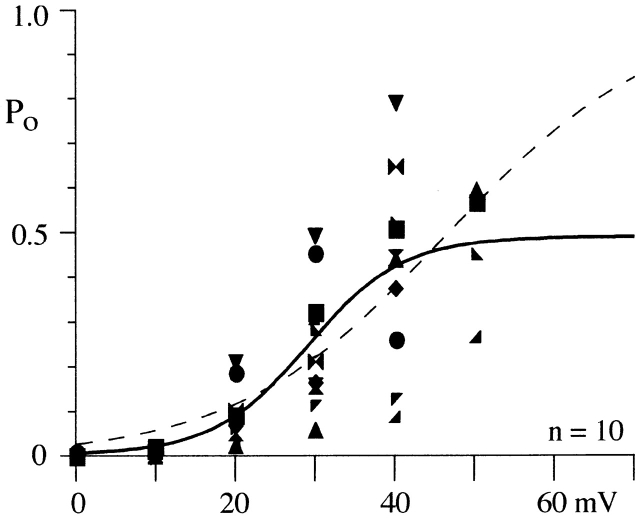
Figure 2.
N-channel P o varies across patches. The mean P o (including null sweeps) for each patch is plotted for all voltages examined. Data from each of the 10 single N-channel patches is shown as a different symbol, and the same symbol code is used again in Fig. 4. The solid line is from a single Boltzmann fit to all points. The parameters for the line are V1/2 = 29 mV, slope = e-fold for 6 mV, and maximum P o = 0.49. The dashed line is single Boltzmann fit constrained to P o = 1. For this fit, V1/2 = 47 mV and slope = e-fold for 13 mV.

