
Figure 4.
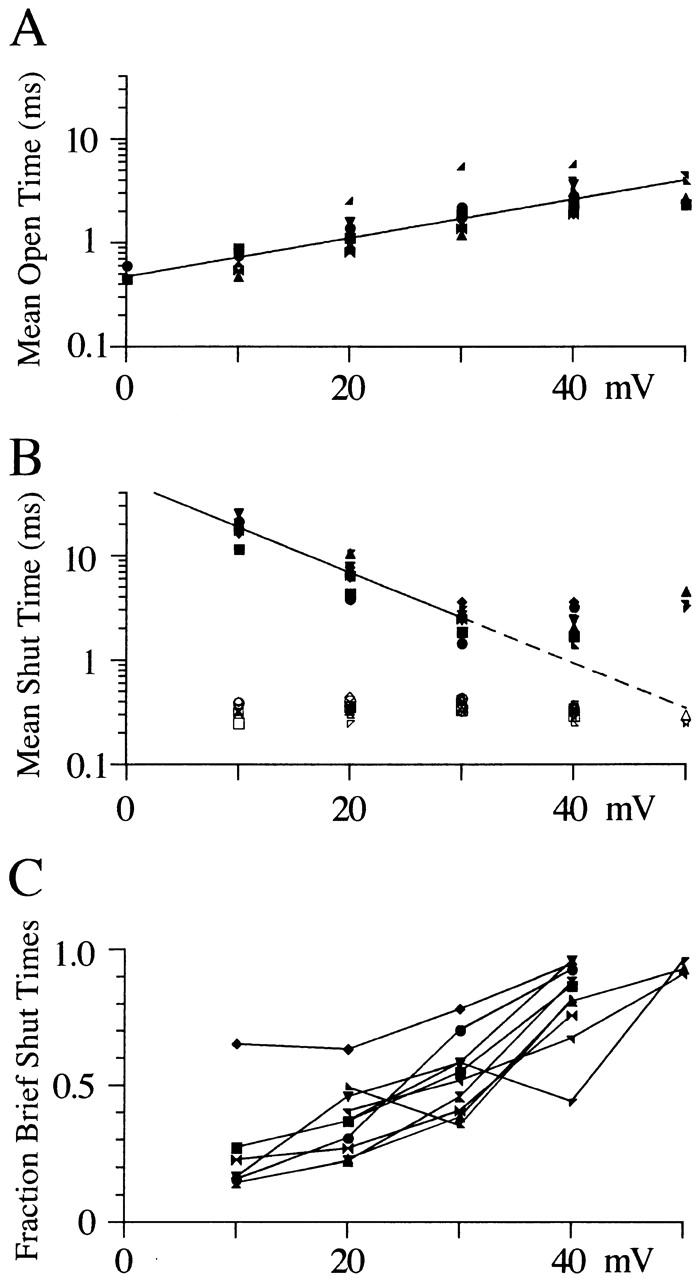
The effect of voltage on open and shut times is similar for all N-channel patches studied. (A) Mean open times from single-exponential fits to log-binned histograms are plotted against voltage for each of the 10 single N-channels studied. The same symbol code adopted for Fig. 1 is used here. The line shows an e-fold change in open time for 23 mV. Note that the number of observations is only 2 for 0 mV and 5 for +50 mV. (B) Mean shut times are plotted against voltage for each of the two exponential components. The line shows an e-fold change in shut time for 10 mV. (C) The fraction of brief shut times was calculated by dividing the amplitude of the brief exponential component by the sum of both exponential component amplitudes. The fractional shut times are plotted against step potential. The lines connect points from the same patch.