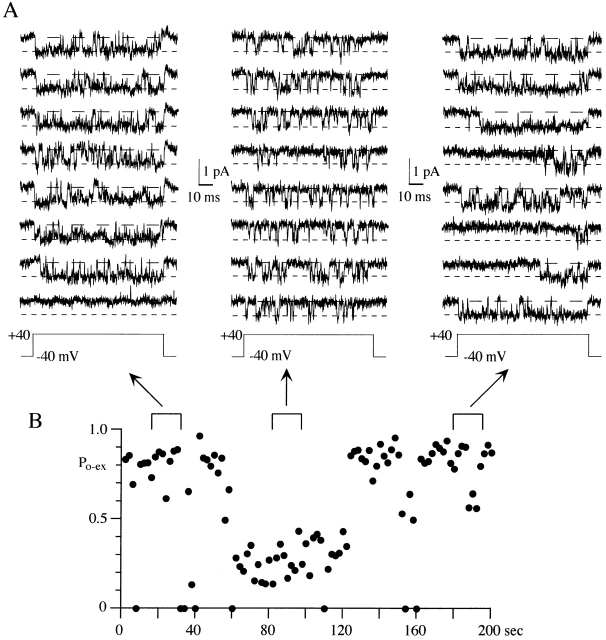
Figure 6.
A single N-channel can show continuous periods of low P o gating. (A) Eight consecutive sweeps are shown from three regions of 100-ms voltage steps to +40 mV. Early and late in the data set, the N-channel exhibited high P o gating (P o > 0.5). However, after sweep 30, the channel switched to low P o gating for the next 33 sweeps (∼66 s). Note the shorter open times and longer shut times during low P o gating. Slow activation (long first latency) is also seen in three of the last eight sweeps shown. This patch contained a single N-channel. (B) P o-ex is shown in this diary plot for each of the 100 sweeps in the +40-mV data set. The brackets above the plot illustrate the areas shown in A.

