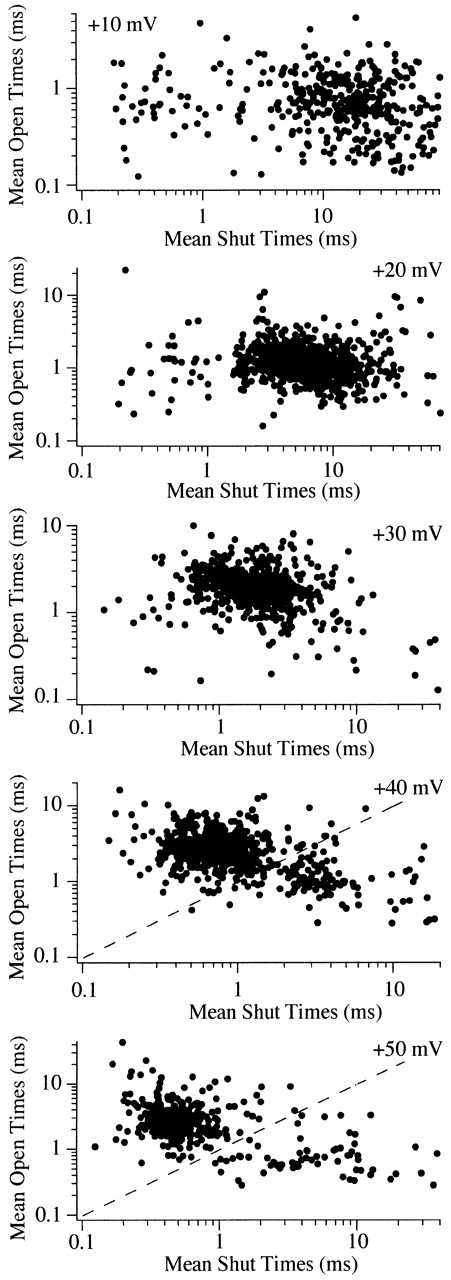
Figure 8.

A plot of mean open vs. mean shut time supports a second gating state at +40 mV. Mean open and mean shut times were calculated for each sweep used to generate Fig. 7 and plotted on a log–log scale. The plot for each voltage shows a main cluster of points that corresponds to the peak of the P o-ex histogram in Fig. 7. However, a second cluster is observed in the plot of the data at +40 mV. The dashed line represents P o = 0.5 and is presented to show the cutoff P o used to calculate the fraction of sweep with high vs. low P o gating.
