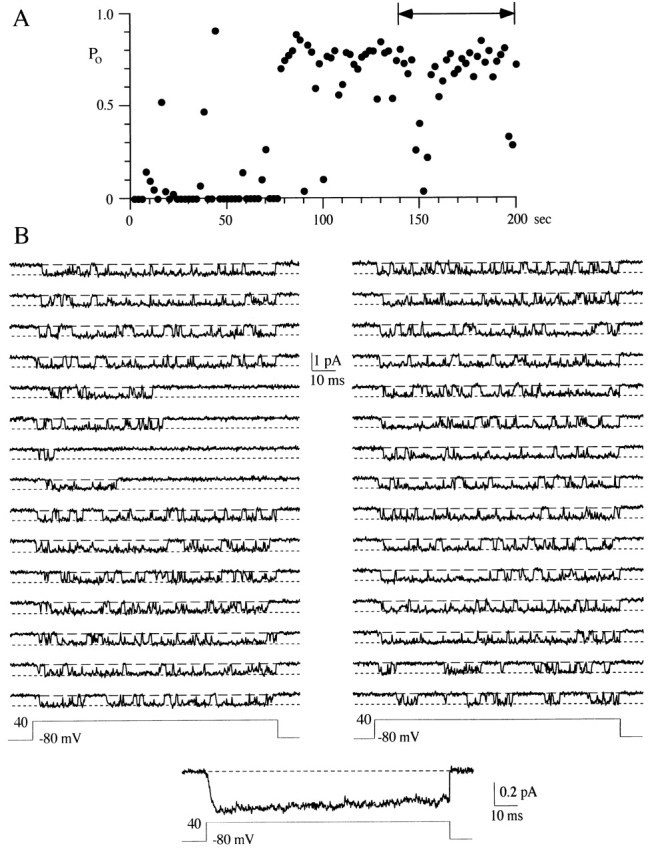
Figure 9.

Inactivation can reduce the P o measured over the duration of the voltage step. (A) A diary plot of P o measured over the 100-ms sweep duration is shown for 100 consecutive voltage steps to +40 mV. This patch contained a single N-channel. The holding potential was −80 mV and the interval between sweeps was 2 s. The two-headed arrow shows the area illustrated in B. (B) 30 consecutive sweeps are shown for voltage steps to +40 mV. The pseudomacroscopic current at the bottom of the single channel records was averaged from 100 sweeps.
