
Figure 2.
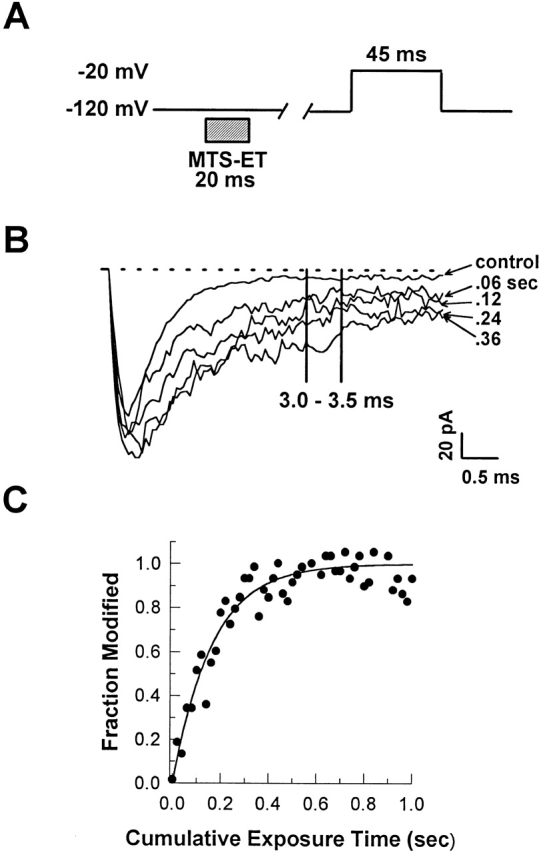
Measurement of the rate of MTS-ET modification of F1304C in the presence of lidocaine. The experimental protocol shown in A consists of a series of 20-ms exposures of excised inside-out patches to 8 μM MTS-ET with test pulses between each exposure. 1.0 mM lidocaine was present at all times. In B, selected traces from the modification experiment described in A are superimposed. To determine the degree of modification after each trace, the value of the macroscopic current between 3 and 3.5 ms after depolarization was averaged. Rates were determined by fitting the degree of modification of each trace as a function of cumulative exposure time with a monoexponential containing a maximum value after complete modification, a nonzero initial value before modification, and a time constant as free parameters. C shows these averages, normalized to the difference between the maximum value and the initial value, plotted against cumulative exposure time, with the normalized curve fit superimposed.