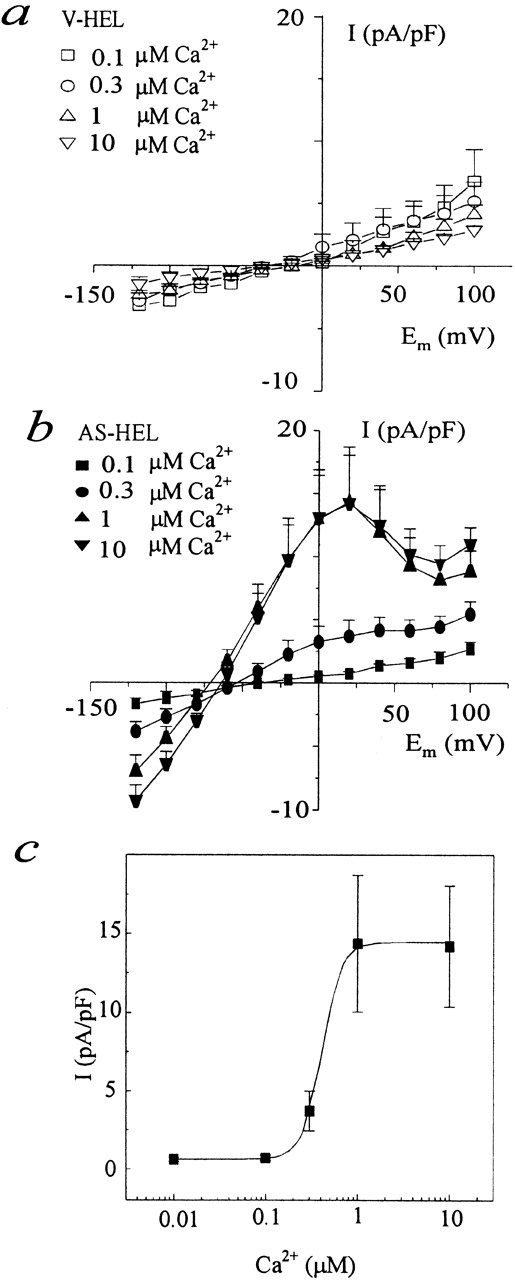
Figure 7.

Membrane current of AS-HEL and V-HEL cells dialyzed with internal solutions containing different concentrations of free calcium. (a and b) I–V relationship of V-HEL and AS-HEL cells dialyzed with internal solutions containing the indicated free calcium concentration. Current elicited by the voltage steps (see Fig. 6) is measured at 95 ms into the voltage step and is plotted as the mean ± SEM (five to nine cells in each group). (c) The data from b for the membrane current elicited by the voltage step to +20 mV are replotted as a function of the free calcium concentration in the pipette solution. In addition, the membrane current from cells dialyzed with 0.01 μM Ca2+ (n = 5) are also plotted. Data are given as the mean ± SEM and were fit with the Hill equation: I = I max/[1 + (C 1/2/C)n] with n = 4 and C 1/2 = 0.4 μM.
