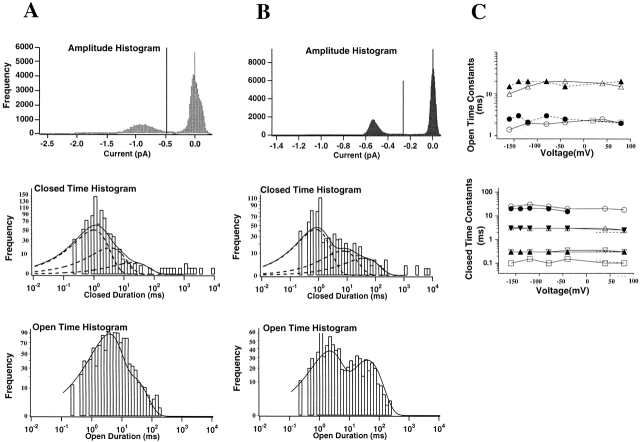
Figure 5.
Analysis of single channel currents from the 1247Q mutant at −40-mV test potential in symmetric 115-mM K+ solutions (A), and in external 115-mM Rb+ solution (B). For each solution, single channel amplitude histograms are shown (top) together with logarithmic open time (bottom) and closed time distributions (center). Lines of fit were obtained using a maximum likelihood method. Dashed lines indicate individual exponential components. (C) Open time constants and the four closed time constants are plotted as functions of test potential, data from 124Q (open symbols), and from 1247Q (solid symbols). The mean open time for wild-type ShΔ is indicated as open square at the voltage of 20 mV. The three closed time constants for wild-type ShΔ are indicated as the dashed line. Data in A and B were from two representative patches. Data in C are means.

