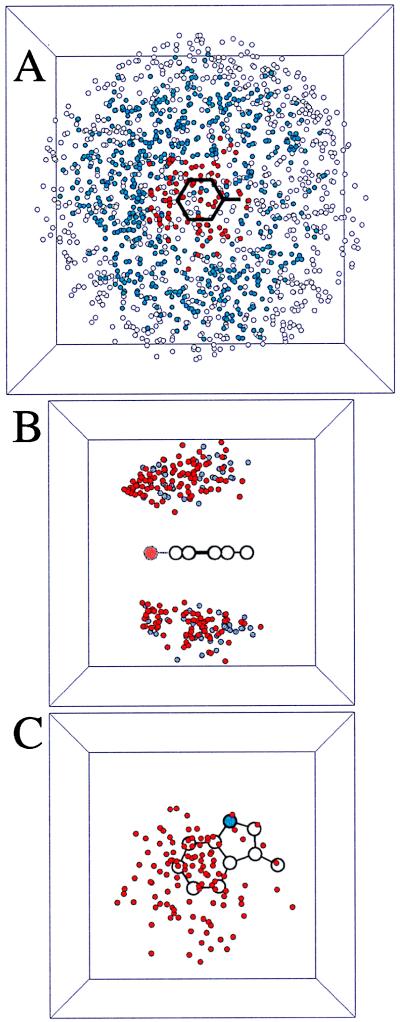
Figure 2.
Scatter plots from the analysis of all 323 single subunit proteins. In each case, the cation is Lys, and a circle denotes the location of the sidechain N in one particular pair. Pictures are projections of a 10- × 10- × 10-Å cube in A and a 7- × 7- × 7-Å cube in B and C. (A) All Lys-Phe interactions. The phenyl ring plus the β carbon are denoted by black lines. A red circle denotes an interaction that is an accepted cation-π interaction; a blue circle denotes an interacting pair; a white circle denotes a structure rejected by the gap criterion. In this projection view, a few open/blue circles are seen to lie over the ring, but they are too far “above” the ring to have a favorable cation-π interaction. (B) Cation-π interactions involving Lys and Phe (gray circles) or Tyr (red circles). Note clustering of Tyr interactions near the phenolic oxygen (larger, light red circle). (C) Top down projection of all Lys-Trp cation-π interactions. The indole N is a blue circle. Note the cluster of structures above the six-membered ring.

