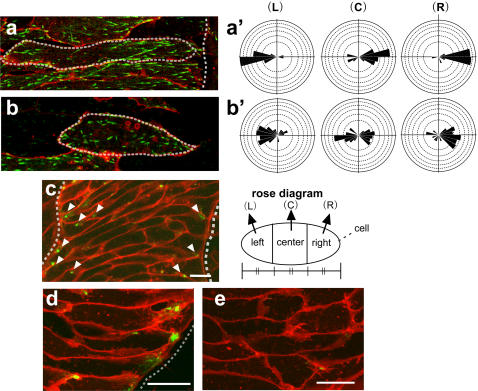
Figure 2. Notochord-somite boundary and/or extra-notochord tissue attracts EB3 movement.
(a) A relatively late notochord cell (Stage 13∼) that was proximal to the boundary. The cell was divided into three regions (left: L, center: C, right: R) of equal horizontal (mediolateral) length for tracking the EB3 comets to clarify the direction of their movement. The EB3 movements were highly biased and mostly rightward in the center portion (a'). (b) A late notochord cell (Stage 13∼) that was distant from the boundary. No significant bias of the EB3 movement was observed (b'). (c) APC-GFP localization in the notochord in Keller explant. (d) APC-GFP localization in the chordamesoderm cells near the boundary in Keller explants. The localization was restricted to the one cell end pointing toward the boundary. (e) APC-GFP localization in the chordamesoderm cells located in the center of the notochord. Note that the localization was diffuse and unfocused. The dotted line indicates the notochord-somite boundary, and arrowheads indicate the localization of APC-GFP. Scale bars, 20 µm. Each scale of the rose diagrams corresponds to 10%.

