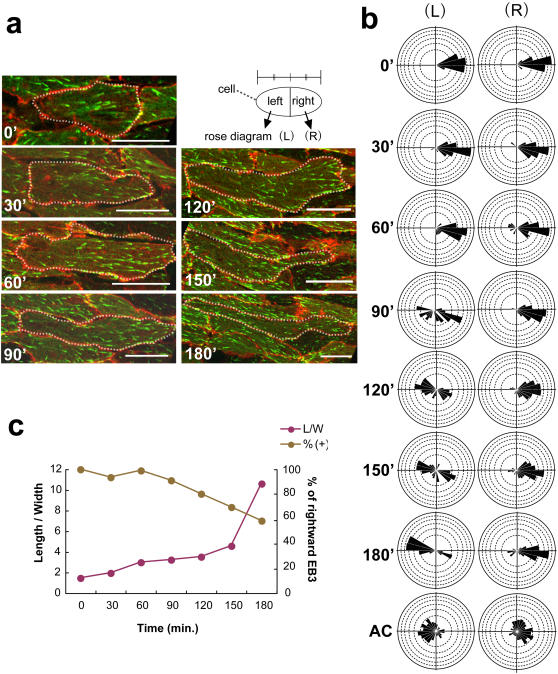
Figure 3. EB3 shows polarized movement independent of cell morphology in the early phases.
(a) Time course of cell-shape change from 0' to 180' in Keller explants. The dashed lines outline the shape of the cells. (b) Rose diagrams of EB3 movement in the indicated cells. Each cell was divided into left and right portions at the center of the horizontal (mediolateral) cell length, and the EB3 movements in each portion were plotted as rose diagrams. (L) Left and (R) right. (c) Correlation between cell shape (length/width) and bias of EB3 movement (rightward EB3; −45° to +45°). Note the biased rightward movement without significant cell-shape change. Scale bars, 20 µm. Each scale of the rose diagrams corresponds to 10%.

