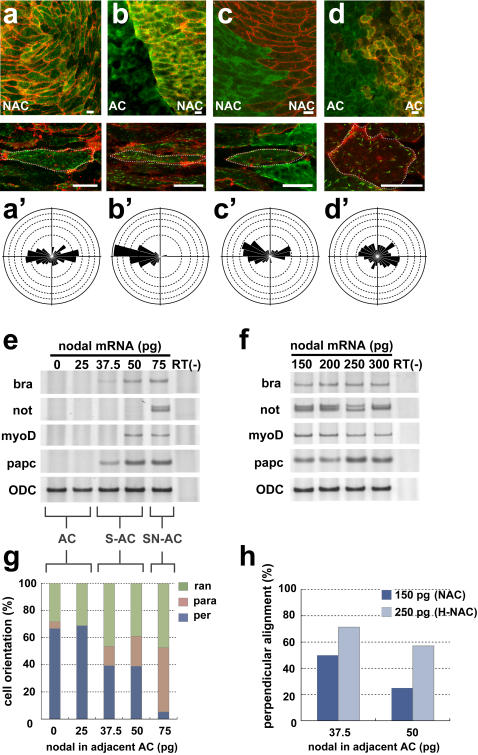
Figure 4. A heterogeneous combination of tissues can confer planar cell polarity.
(a) The single culture of animal cap expressing a high concentration of Nodal mRNA (125–150 pg: NAC). (b) Combined culture of uninjected animal cap (AC) and NAC. Homogenous combined cultures of NAC (c) and AC (d). The EB3 in the cells in panels a–d respectively, was tracked. (a'–d') Rose diagrams of the EB3 movements in cells a–d. (e) RT-PCR (reverse transcription-polymerase chain reaction) analysis of low concentration of Nodal-mRNA (25–75 pg) injected animal caps. Animal caps into which a relatively high concentration of Nodal mRNA (75 pg: SN-AC) was injected expressed the chordamesoderm and somite marker, Xnot and XmyoDa, papc, and those receiving a relatively low concentration of Nodal mRNA (37.5–50 pg: S-AC) expressed only the somite marker, XmyoD. (f) RT-PCR analysis of high concentration of Nodal-mRNA (150 pg–300 pg: NAC, H-NAC). (g) The angle of the cell body in relation to the border in NAC (150 pg) combined with explants treated with different Nodal levels (0–75 pg of mRNA). Cell alignment perpendicular to the boundary, representing the mediolateral polarity, was observed when the combination was heterogeneous and loss when the combination became more homogeneous (37.5–75 pg). (per: perpendicular, para: parallel, ran: random) (h) The ratio of perpendicularly aligned cells in relation to the border was altered by difference of nodal signaling level. The cells in H-NAC (250 pg) tended to align perpendicular to the border with S-AC (37.5–50 pg). Scale bars, 20 mm (a–d). Each scale of the rose diagrams corresponds to 10%.

