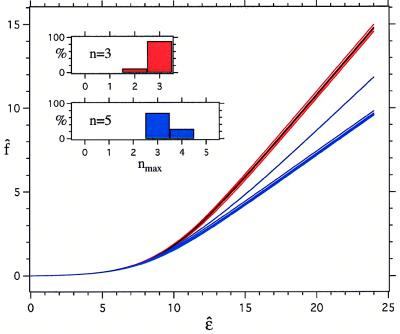
Figure 2.
The reduced free energy as a function of the reduced energy. The black line is obtained assuming independent interactions. The red and blue lines are the simulation results for f̂ with n = 3 and n = 5, respectively, for five different randomly chosen configurations of the neighbors. The same map, with a = 0.01 and s = 25, was used for both sets of simulations. For a given configuration of neighbors, the probability p(m; n) that the central particle makes m contacts was calculated (for each m in the range 0 ≤ m ≤ n) by directing counting of the contacts for 10 million random orientations of the central sphere. The reduced free energy then was obtained from f̂ = (2/n)ln[Σm=0n p(m; n)exp(mɛ̂/2)]. The inset shows the percentage of simulations in which the maximum number of contacts made is nmax.

