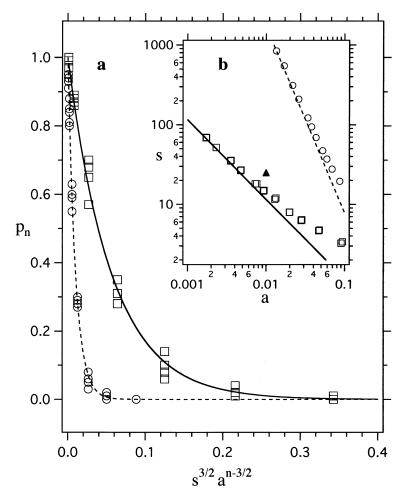
Figure 3.
(a) The probability pn of not making all n contacts. The open symbols are the simulation results for n = 3 (squares) and n = 5 (circles). Vertical clusters of points represent maps with the same s and a but different random patterns of the attractive spots. For a given configuration of neighbors, a large sampling of orientation space was performed to search for orientations of the central particle in which all n contacts were made. This search was performed by combining random reorientations of the particle with small rotations about a randomly chosen axis to ensure a thorough sampling of all possible orientations. The probability pn was calculated by counting the number of configurations of neighbors (of 100 randomly chosen ones) in which the central sphere did not make all n contacts. The theoretical results for n = 3 (solid line) and n = 5 (dashed line) also are shown (see Eq. 3). (b) The boundary for averaging the potential. The open symbols are the simulation results for n = 3 (squares) and n = 5 (circles). The values of s and a for each symbol are those that give pn = 0.5. They were obtained by interpolating the simulation results for many different values of s and a that give pn ≈ 0.5. Above the open symbols, the potential is averageable for the corresponding n; below, it is not. The lines are the results expected for n = 3 (solid) and n = 5 (dashed) from Eq. 3. The solid triangle corresponds to the values of s and a used in Fig. 2.

