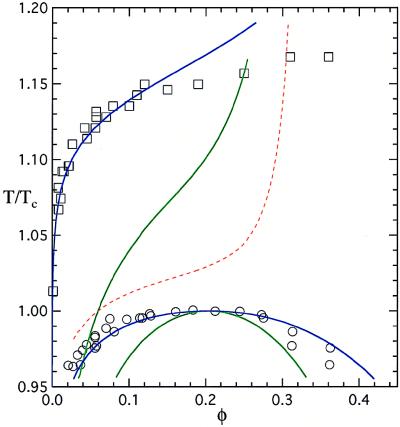
Figure 4.
The phase diagram of γIIIb-crystallin. The open symbols are the experimentally determined liquidus line (squares) and coexistence curve (circles) for the protein. The green lines are the predictions for the boundaries assuming temperature-independent isotropic square well interactions (2). The blue coexistence curve is obtained for a square-well potential (1) with λ = 1.25 and ɛeff(T) given by Eq. 2 with ɛ = 9kBTc and a = 0.01. The blue liquidus line is obtained by equating the chemical potential of the liquid, with the above λ and ɛeff(T), to the chemical potential of the solid with the parameters given in the text. The dashed red liquidus line corresponds to a solid interacting through the same effective isotropic potential ɛeff(T) as the liquid.

