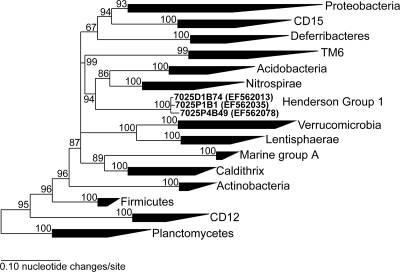
FIG. 3.
Phylogenetic tree showing representative bacterial divisions constructed with Bayesian inference. Sequences that form the Henderson group 1 are shown in bold. Numbers at bifurcations indicate posterior probabilities calculated by MrBayes v3.1. The rooting archaeal outgroup (a sequence from Halobacteria) has been removed for clarity.

