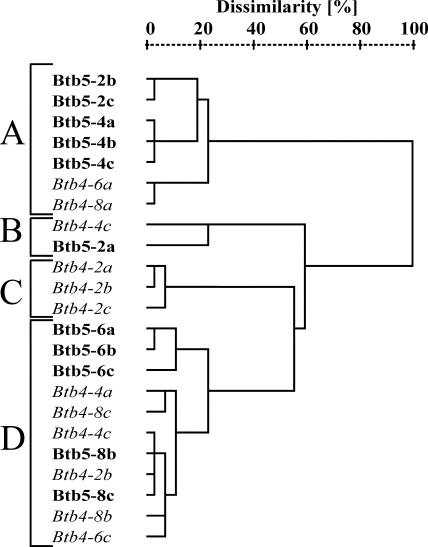
FIG. 5.
Comparison of the bacterial community compositions in depth profiles from two sediment cores from sampling sites Btb4 and Btb5 in the middle reach of the Breitenbach. The dendrogram was prepared as described in the legend to Fig. 2. Depths are indicated as follows: 2, 0 to 2 cm; 4, 2 to 4 cm; 6, 4 to 6 cm; and 8, 6 to 8 cm. Suffixes a to c denote subsamples.

