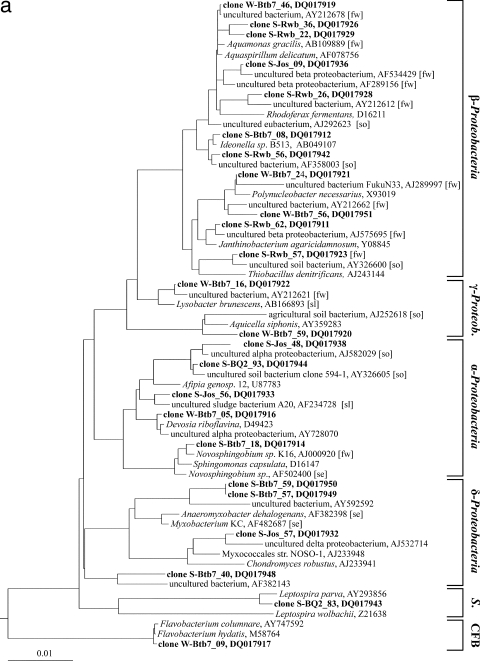
FIG. 6.
Phylogenetic trees based on partial 16S rRNA gene sequences obtained from bacteria from water and sediment samples (in boldface) and their nearest relatives from GenBank. Sequences are coded by sample designation, clone number, and GenBank accession number. If known, the habitat of the nearest relative is given in brackets (fw, freshwater; se, sediment, freshwater, or estuary; so, soil; and sl, activated sludge). The trees were generated by using the ARB software package with the maximum-likelihood algorithm. (a) Proteobacteria (γ-Proteob., Gammaproteobacteria), Spirochaetes (S.), and the Bacteroidetes/Chlorobi group (CFB). The scale bar represents 1 nucleotide substitution per 100 nucleotides. (b) The Fibrobacteres/Acidobacteria group, Verrucomicrobia (Verruco.), and Planctomycetes (Plancto.). The scale bar represents 1 nucleotide substitution per 20 nucleotides. (c) Actinobacteria and Chloroflexi (Chl.). The scale bar represents 1 nucleotide substitution per 20 nucleotides.


