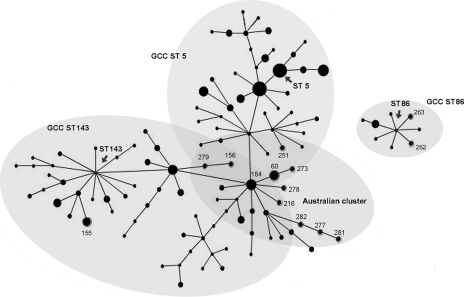
FIG. 3.
Snapshot of global population structure of S. uberis generated by eBURST. The three GCCs (ST143, ST5, and ST86) and the Australian cluster are represented by light shaded ovals. The Australian isolates are indicated by numbers corresponding to their ST. The sizes of the dots are in direct proportion to the size of the population. Single-locus variants are joined by lines.

