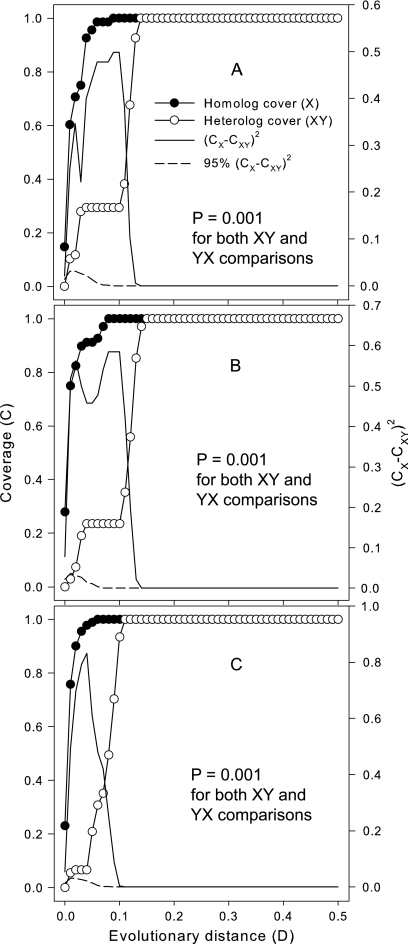
FIG. 2.
LIBSHUFF comparison of the homologous and heterogenous coverages between the CK and NPK libraries (A), the CK and MNPK libraries (B), and the NPK and MNPK libraries (C). X represents the CK library in panels A and B and the NPK library in panel C. Y represents the NPK library in panel A and the MNPK library in panels B and C. The fact that the P values produced by both the XY and YX comparisons are smaller than the critical P value of 0.025 indicates that the two libraries being compared are different.

