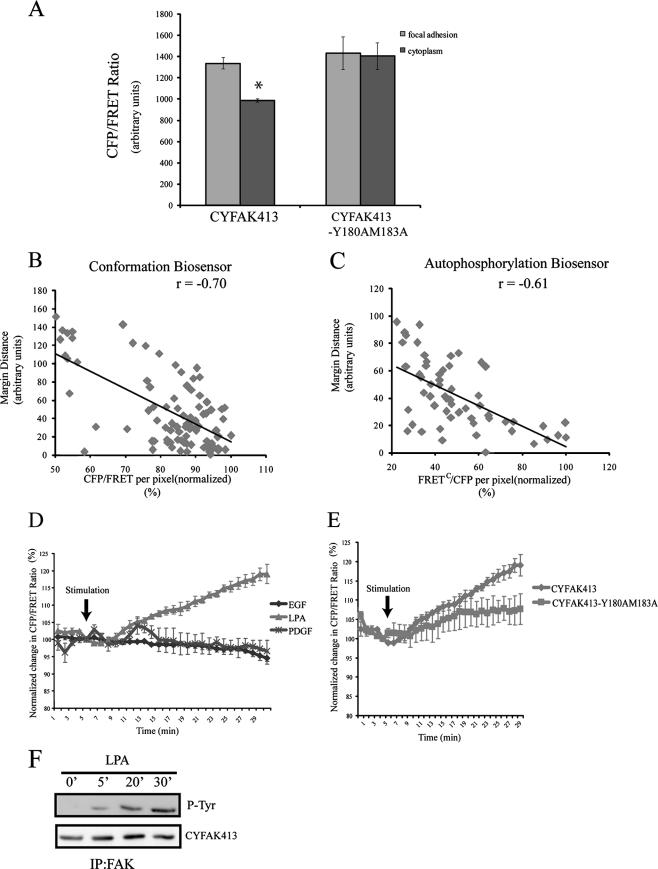
FIG. 5.
(A) Average CFP/FRET ratio of the cytoplasm or focal adhesions in HeLa cells expressing the wild-type biosensor or the constitutively active variant (average of n = 4 cells). The focal adhesion and cytoplasmic values were analyzed using an unpaired t test (*, P < 0.0005). (B and C) The relationship between biosensor activity and focal adhesion location is shown. The distance of each focal adhesion from the cell margin is plotted versus the average CFP/FRET or FRETC/CFP ratio, where the highest ratio has been normalized to 100%. Representative data from single cells are shown (n = 4). r, correlation coefficient. (D and E) HeLa cells expressing the FAK biosensor were serum starved and simulated with LPA (200 ng/ml), EGF (50 ng/ml), or PDGF (50 ng/ml). CFP and FRET images were sequentially captured at 1-min intervals. The mean CFP/FRET ratio of cells was calculated and normalized to the ratio at the time of stimulation. The change in the emission ratio of the FAK biosensor following EGF, PDGF, or LPA stimulation is shown in panel A. The change in the emission ratio of the wild-type FAK biosensor is compared with that of the constitutively active FAK biosensor mutant following LPA stimulation in panel B. Shown is the average response ± standard error (n = 3 cells). (F) HeLa cells expressing the biosensor were stimulated with LPA and lysed at the indicated times. The biosensor was immunoprecipitated (IP) and blotted with a phosphotyrosine (P-Tyr) antibody (top) or FAK antibody as a loading control (bottom).

