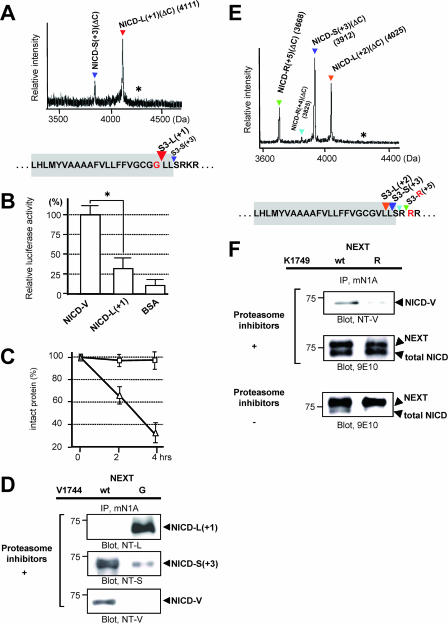
FIG. 8.
Characteristics of the NICD species generated from the Val→Gly and the Lys→Arg mutants in cultured cells. (A) MS spectrum of de novo NICD(ΔC) generated from the Val→Gly mutant of NEXTΔC in K293 cells. The asterisk indicates the position of molecular mass corresponding to NICD-G(ΔC) species. Colored letters and inverted triangles show the mutation and proteolytic sites, respectively. (B) Assay of Notch downstream signaling induced by NICD-L(+1). Experiments were performed as described for Fig. 5B. The luciferase activity in the NICD-V-loaded cells was defined as 100%. Values represent means ± standard deviations. (n = 3). The asterisk indicates that the relative luciferase activity in NICD-V-loaded cells is statistically different than that in NICD-L(+1)-loaded cells (P < 0.001). (C) Degradation of NICD-L(+1) species in vitro. Experiments were performed as described for Fig. 5C but using NICD-L(+1) (triangles) and NICD-V (squares). Values represent means ± standard deviations (n = 3). (D) Generation of NICD-L(+1) and NICD-S(+3) in the Val→Gly mutant NEXT cells. K293 cells expressing either wt or the Val→Gly mutant NEXT were analyzed as described for Fig. 2D. (E) MS spectrum of de novo NICD(ΔC) generated from the Lys→Arg mutant of NEXTΔC in K293 cells. The asterisk indicates the position of molecular mass corresponding to NICD-V(ΔC) species. Colored letters and inverted triangles show the mutation and proteolytic sites, respectively. (F) Generation of unstable NICD species in the Lys→Arg mutant NEXT cells. K293 cells expressing either wt or the Lys→Arg mutant NEXT were analyzed as described for Fig. 2D (top and middle panels).

