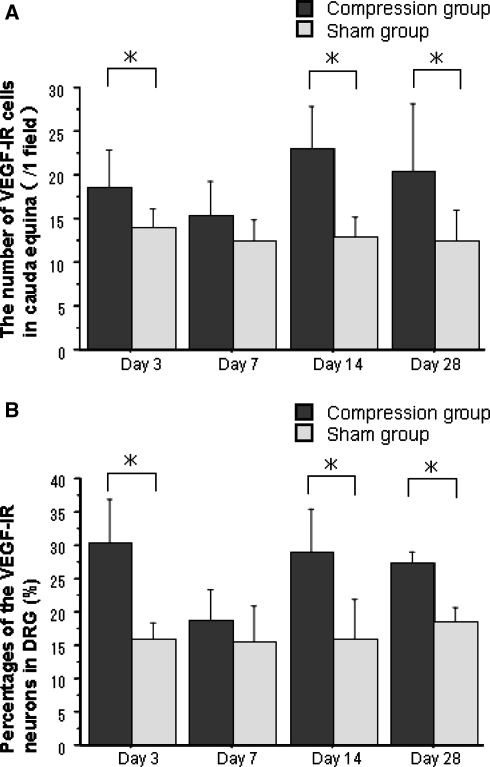
Fig. 4.
Histogram presenting numbers of VEGF-IR cells in the cauda equine (a) and percentages of VEGF-IR neurons in the DRG (b). In the compression group, numbers of VEGF-IR cells in the cauda equina and percentages of VEGF-IR neurons in DRG were significantly increased at days 3, 14, and 28 after surgery compared with the sham-operated group (*P < 0.05). Results are the mean ± standard deviation

