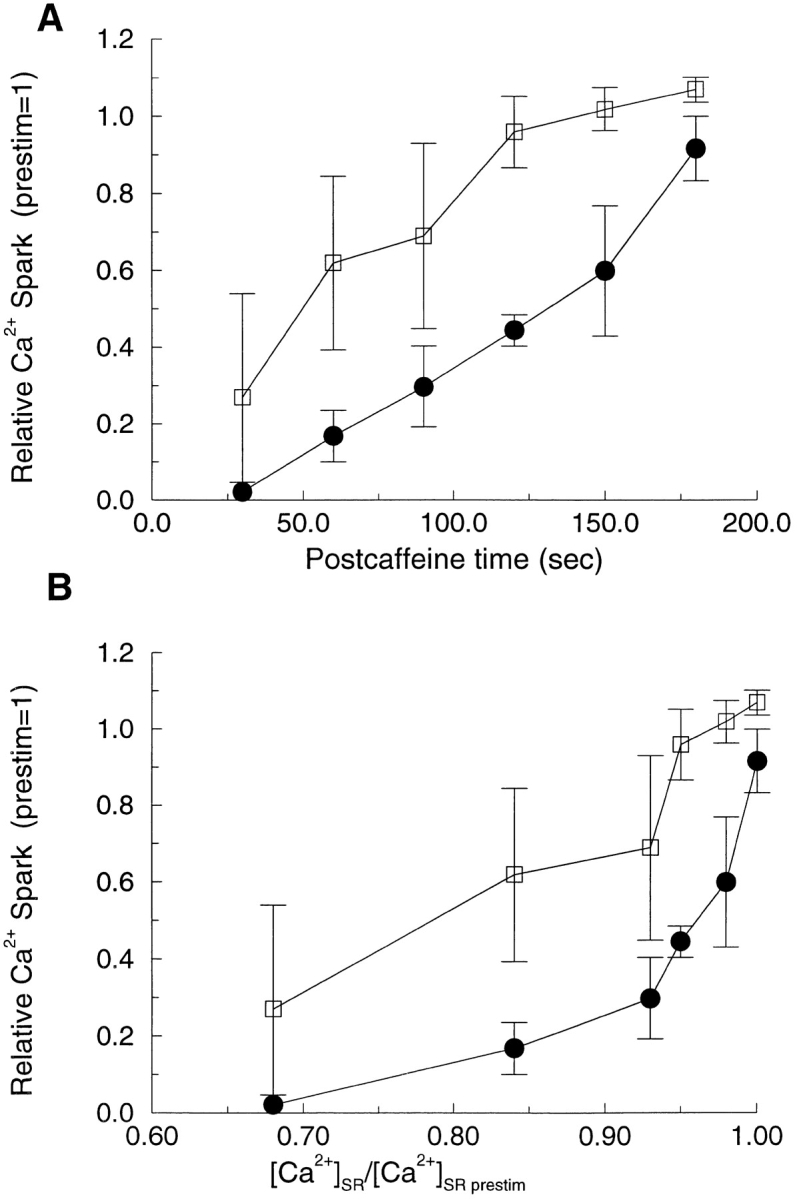
Figure 8.

Relationship between [Ca2+]SR and Ca2+ sparks. (A) Relationship between time after a 3-s caffeine application and amplitude (□) and frequency (•) for Ca2+ sparks. After the caffeine application, Ca2+ sparks ceased, and then recovered as the SR refilled. (B) Relationship between fractional [Ca2+]SR and spark frequency (•) and amplitude (□) determined as described in the text. Images were acquired as in Fig. 2, and the amplitude and frequency of Ca2+ sparks were normalized to values before the application of caffeine (n = 4 cells).
