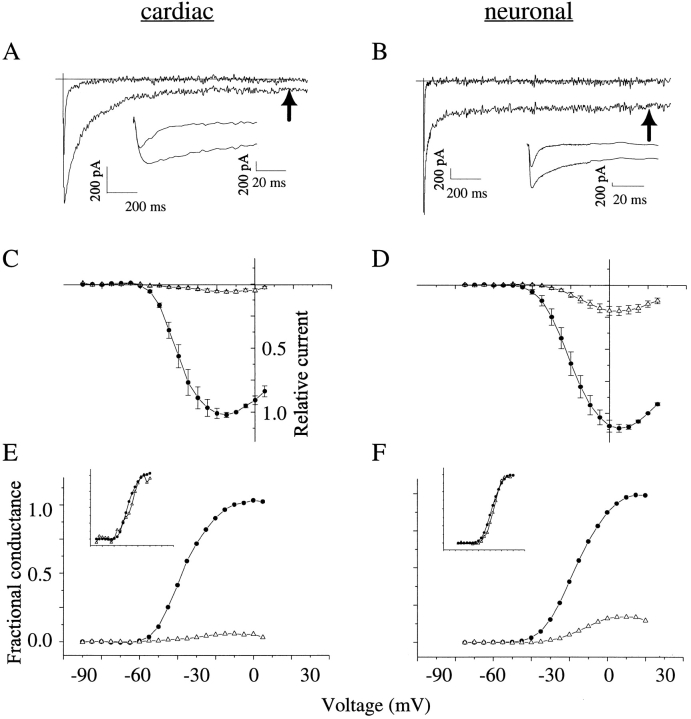
Figure 1.
Site-3 toxins induce a persistent Na+ current. Cells were modified to completion with saturating doses of ApB. (A) Cardiac INa in response to depolarization to −10 mV; traces show INa before (top) and after (bottom) toxin modification. Inset shows expanded time scale. Arrow denotes the time at which plateau currents were measured for use in conductance calculations (cell 97n10044, Rm = 0.6 GΩ). (B) Neuronal INa in response to depolarization to +20 mV, as above (cell 98209008, Rm = 0.8 GΩ). Currents were leak- and capacity-corrected as described in methods. (C) Peak (•) and steady state (▵) current–voltage relations for cardiac channels, normalized by the peak current at −10 mV (n = 4). (D) Peak (•) and steady state (▵) current–voltage relations for neuronal channels, normalized by the peak current at +20 mV (n = 7). (E) Conductance–voltage relations of cardiac INa. Reversal potentials were constrained to those predicted by pipette and bath solutions. Fits to peak and steady state current– voltage relations with the product of the Boltzmann equation and Ohm's law yielded the following values. Peak half-point, −35 ± 3 mV; peak slope, −7.3 ± 1.1 mV; plateau half-point, −36 ± 2 mV; plateau slope, −7.4 ± 0.7 mV. For illustrative purposes, normalized current–voltage data were conductance-transformed by Ohm's law and normalized by the maximal conductance of peak current. Inset shows the plateau current independently normalized to 1.0. (F) Conductance–voltage relations of neuronal INa, as above. Peak half-point, −14 ± 2 mV; peak slope, −8.3 ± 0.2 mV; plateau half-point, −13 ± 2 mV; plateau slope, −6.4 ± 0.5 mV.

