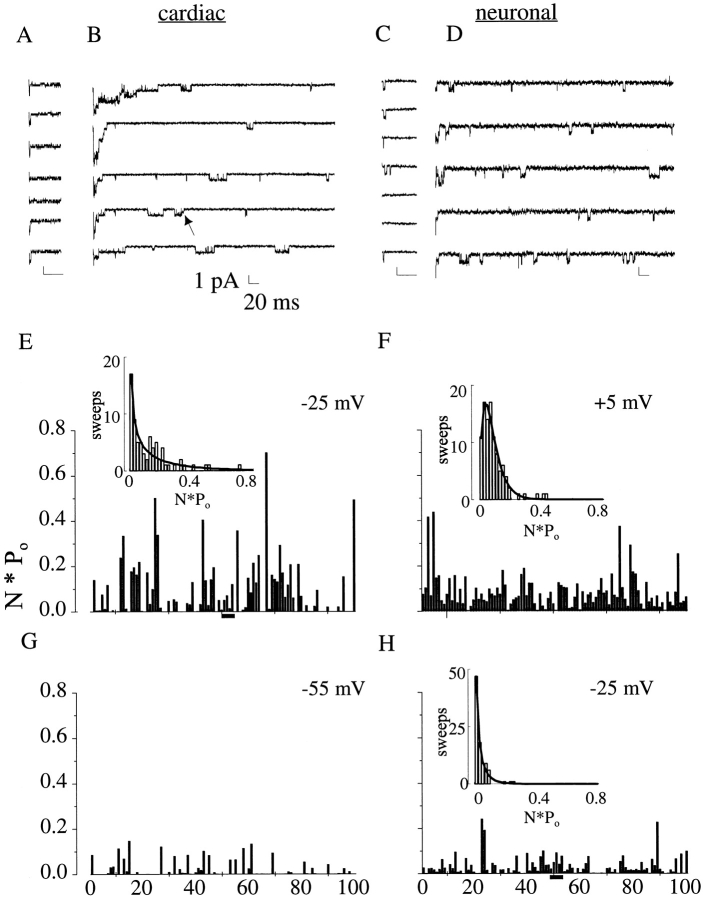
Figure 4.
Persistent current arises from late channel reopenings. (A–D) Single-channel currents arising from cardiac (A and B) and neuronal (C and D) channels in the absence (A and C) and presence (B and D) of saturating concentrations of ApB. Contiguous traces are shown in response to depolarizations to −25 mV. Control patches typically contained three or fewer channels; patches in the presence of toxin contained many channels. (Arrow) Brief subconductance. (E–H) n*P o diaries of toxin-modified cardiac (E and G) and neuronal (F and H) channels with voltages as shown. Diaries reflect activity from 500 to 1,000 ms after the onset of depolarization, and were calculated for each sweep as Σ(conductance level * time)/Σ(time). Bars in E and H mark the sweeps depicted in B and D, respectively. (Insets) Histograms of sweeps as a function of n*P o activity. (Curves) Best fits of histogram data with gamma distributions. The fraction of excess plateau current in the high n*P o tails of the histogram is (E) −10%, (F) +8%, and (H) +9%. The data set shown in G lacked sufficient openings to produce an acceptable fit to histogram data.

