
Figure 5.
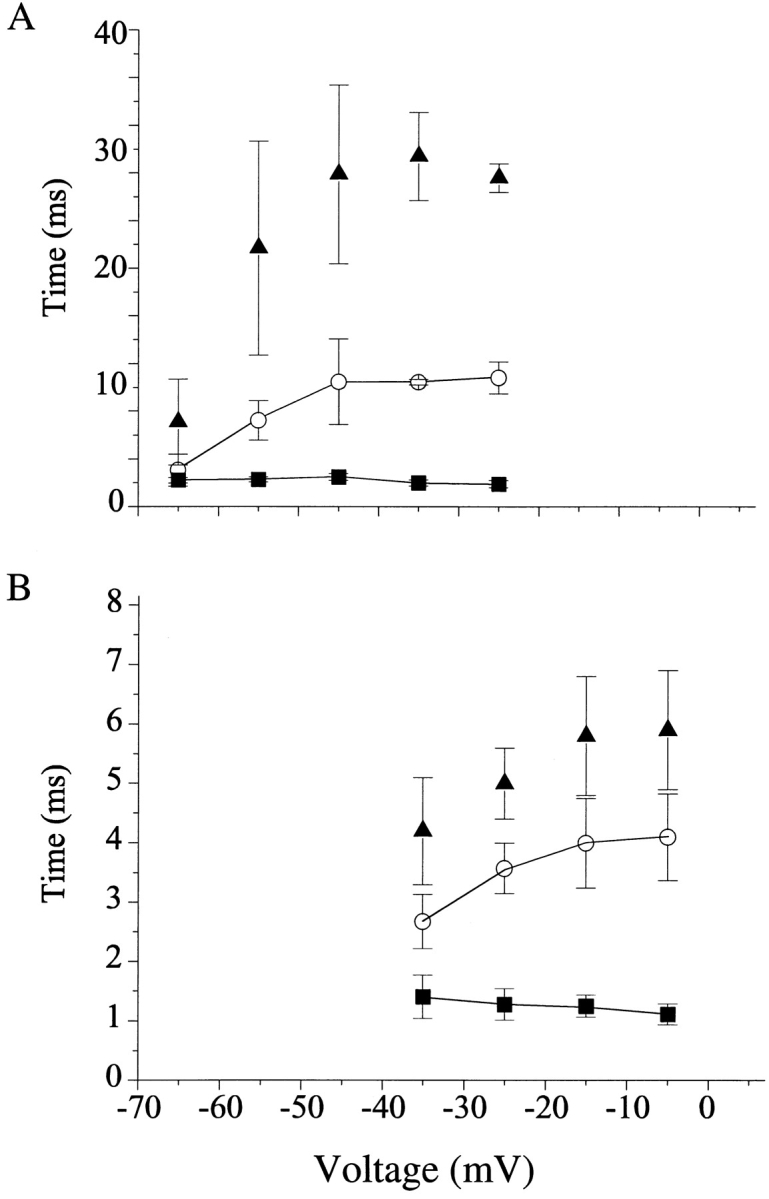
Mean open times of single channel openings recorded from cardiac (A) and neuronal (B) channels. Open-time histograms were calculated from idealized traces of control patches (▪), and patches modified by ApB (○), and were fit with single exponentials. In toxin patches, only events arising from late reopenings were included. Burst times (▴) of toxin-modified patches were taken from single exponential fits to burst-time histograms as described in the text. Cardiac/toxin, n = 4; cardiac/control, n = 5; neuronal/toxin, n = 4; neuronal/control, n = 4. Two patches from neuronal channels (one in control, one with toxin) displayed greatly prolonged mean open times and were not included in this analysis.