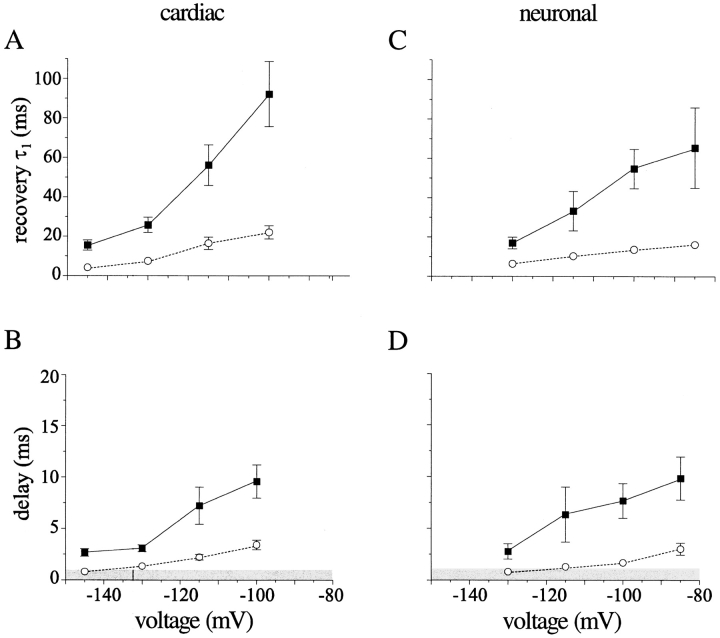
Figure 8.
Toxin enhances recovery from inactivation. Individual recovery diaries (as in Fig. 6) were fit with an initial delay, followed by a double exponential approach. The faster time constant is plotted for cardiac (A) and neuronal (C) channels in the presence (○) and absence (▪) of saturating toxin concentrations. The slower time constant typically comprised ∼25% of the total amplitude in cardiac channels and 35% in neuronal channels, with a slightly higher amplitude in toxin. It usually ranged from 100–400 ms and was somewhat faster in toxin-containing solutions. Although fits with this function yielded reasonable values for the duration of the initial delay, we achieved smaller error by defining the end of the delay empirically as the time at which current during the test pulse had grown to 2% of its asymptotic value at long recovery times. Values obtained using this objective criterion are shown for cardiac (B) and neuronal (D) channels. The grey box denotes delay times ≤1 ms, below which estimates of delay were unre- liable because this was the first time point recorded. No significant delay could be measured at the most negative potential investigated in each isoform (−145 mV for cardiac and −130 mV for neuronal).

