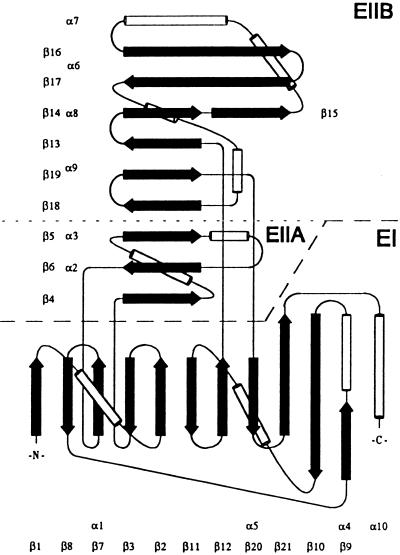
Figure 2.
Topology diagram of the TrpE subunit of anthranilate synthase. The layout corresponds roughly to the view direction in Fig. 3A. β-Strands are depicted as black arrows and α-helices as cylinders. Domain I (green in Fig. 3A) is labeled EI; domain II (yellow in Fig. 3A) is subdivided into the subdomains EIIA and EIIB as described in the text.

