Figure 4.
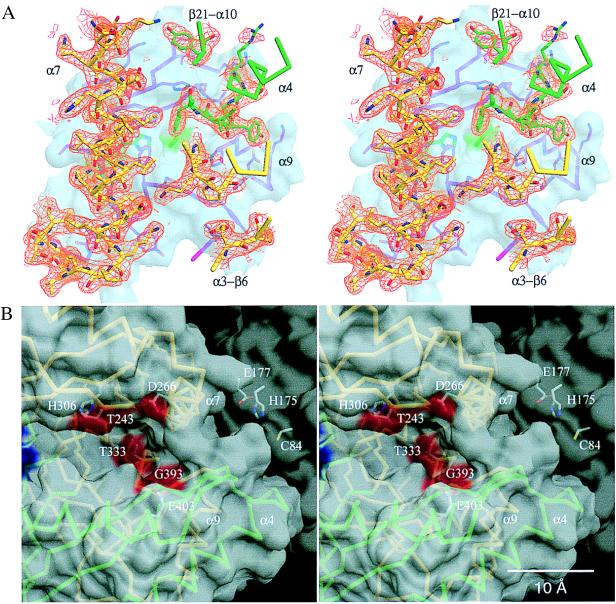
(A) View of the TrpG:TrpE interface. The Cα trace of the TrpE subunit (green for domain I and yellow for domain II) is superimposed on the 2Fo-Fc electron-density map (orange) contoured at 1.0 σ. Secondary structural features of the TrpE subunit are labeled. The TrpG subunit is depicted as a transparent surface in light blue, in which a structural stick model of the contact region of the TrpG subunit is drawn in magenta and atom colors. Residues Cys-84, His-175, and Glu-177 (hidden behind helix α7 of the TrpE subunit) as well as their corresponding surface areas are green. (B) View of the open cleft of the TrpE subunit. To compare the orientation of B to that of A, it is helpful to use the relative positions of helices α4 and α7. Transparent surfaces of the TrpE (light gray) and the TrpG subunit (dark gray) are shown. Surface areas of the TrpE subunit corresponding to residues important for catalysis and feedback regulation are colored red and blue, respectively. The Cα trace of the TrpE subunit is shown (green for domain I and yellow for domain II) with helices α4, α7, and α9 labeled. Catalytically important residues of the TrpE subunit and residues Cys-84, His-175, and Glu-177 of the TrpG subunit are depicted in ball-and-stick with atom colors and are labeled. Drawings produced with dino (A. Philippsen, unpublished work; see http://www.bioz.unibas.ch/∼x-ray/dino).

