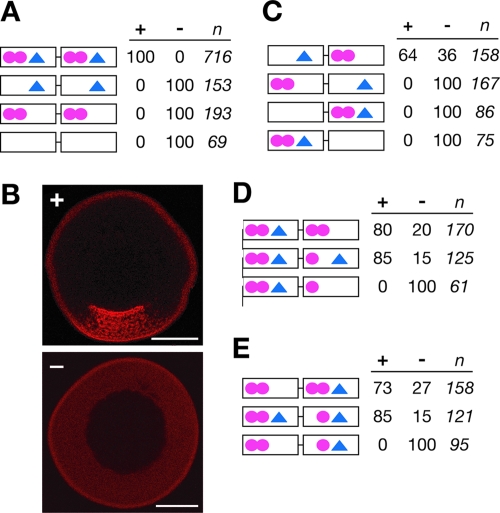
FIG. 3.
E2 and VM1 motifs exhibit spacing and synergistic effects within the VLE. (A) Schematics of wild-type VLE and mutant RNAs, with VM1 motifs (YYUCU, where Y = U or C) shown as circles and E2 motifs (WYCAC, where W = A or C and Y = U or C) represented as triangles. Introduction of mutations into the VM1 sites (YYUCU→AYACA) or E2 sites (WYCAC→UUUGC) is indicated by removal of the site(s) from the diagrams. The results of in vivo localization assays (percent localization) are indicated at the right: + represents normal vegetal localization (set to 100% for the wild type), and − indicates no detectable localization. The number of oocytes (n) injected for each transcript is indicated at the far right. (B) Xenopus stage III oocytes were injected with Alexa 546-labeled RNA transcripts and scored for localization as indicated above for panel A. An example of normal vegetal localization (+) is shown on the top, and an example with no detectable localization (−) is at the bottom. Localization of the injected RNA (red) is evident by accumulation of the RNA in the vegetal cytoplasm, which is at the bottom of the image. The scale bars represent 100 μm. (C to E) Schematics of VLE RNA transcripts containing mutations in E2 motifs (triangles) or VM1 sites (circles), with localization analyses as detailed for panel A, above.

