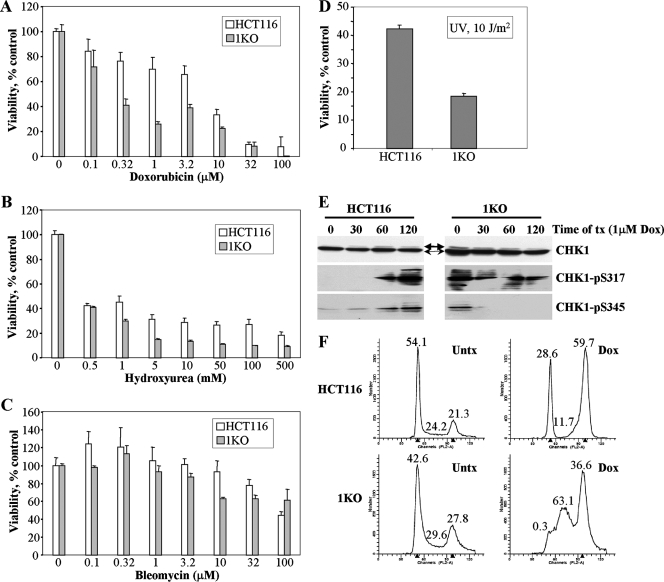
FIG. 8.
Altered cellular responses of HCT116 1KO cells when exposed to other genotoxic agents. (A to D) MTT cell viability assays in parental HCT116 and 1KO cells after exposure to increasing doses of doxorubicin, hydroxyurea, bleomycin, and UV light. All values, presented as the percent viability relative to mock-treated cells, are the average of quadruplicate experiments, and the error bar is the standard deviation. Doxorubicin, hydroxyurea, and bleomycin treatments were for 24 h. (E) CHK1 activation following treatment of parental and 1KO HCT116 cells with 1 μM doxorubicin for the indicated times (in minutes), monitored by quantitative Western blotting. Equal amounts of whole-cell extract were used at each time point, and Western blotting was performed with the antibodies indicated at the right. Thin and thick arrows denote unmodified and phosphorylated forms of CHK1, respectively. (F) Representative cell cycle profiles of HCT116 and 1KO cells exposed to 1 μM doxorubicin for 24 h. The percentage of cells in each phase of the cell cycle is given above the G1, S, and G2/M peaks. Parental HCT116 cells arrest predominantly in G2/M and also in G1, while the G2/M and G1 checkpoints appear to be defective in 1KO cells after doxorubicin treatment. Untx, untreated; tx, treatment; Dox, doxorubicin.

