
FIG. 7.
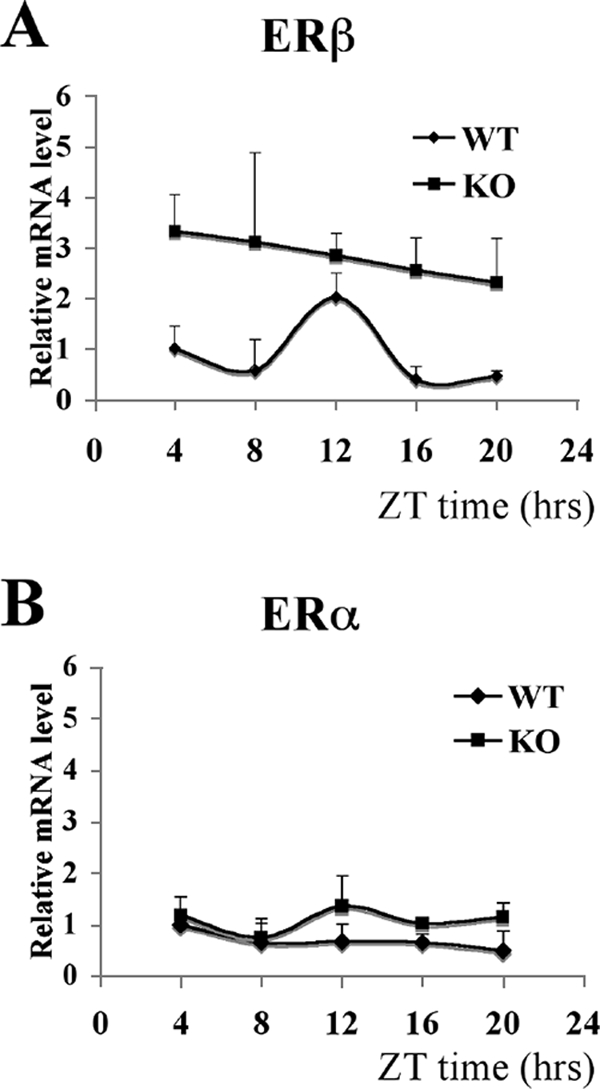
ER expression in WT and KO mouse muscle. (A) mRNA levels of ERβ in WT and KO male mouse muscle were quantified by real-time PCR at five circadian times (ZT4, ZT8, ZT12, ZT16, and ZT20). ERβ expression level in WT muscle at ZT4 was arbitrarily set to be 1. Results are shown as the means ± standard deviations of data for three animals at each time point. ANOVA analyses were used to compare each set of data. For WT mice, P = 0.015; for KO mice, P = 0.76. (B) mRNA levels of ERα in WT and KO male mouse muscle were quantified by real-time PCR at five circadian times (ZT4, ZT8, ZT12, ZT16, and ZT20). The ERα expression level at ZT4 was arbitrarily set to be 1. Results are shown as the means ± standard deviations of three animals at each time point. ANOVA analyses were used to compare each set of data. For WT mice, P = 0.24; for KO mice, P = 0.44.