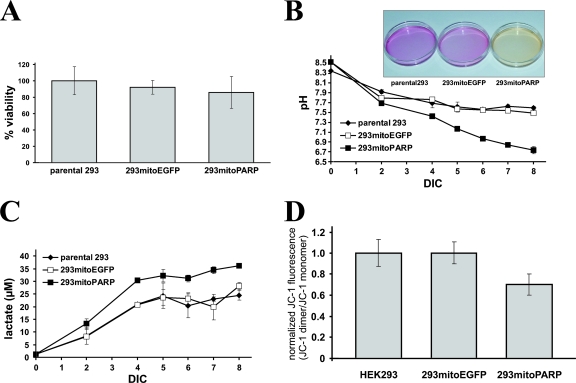
FIG. 3.
Decrease of mitochondrial NAD by mitoPARP expression resembles respiratory deficiency compensated by enhanced glycolysis. (A) Cells were seeded into 96-well plates, and the viability was determined by MTT assays. Data are shown as means ± standard deviations of three experiments, each performed in triplicate. (B) Decrease in medium pH after long-term incubation. Data are presented as means ± standard deviations of three independent experiments. The inset shows representative culture dishes of the cell lines after 7 days in culture (DIC). (C) Increase in medium lactate levels after long-term incubation of the cell lines. Cell culture supernatants from panel B were subjected to determination of the lactate concentration. (D) 293mitoPARP cells exhibit a weaker mitochondrial membrane potential. Cells were loaded with JC-1, and fluorescence spectra were recorded before and after uncoupling the mitochondrial membrane potential by adding FCCP. Relative mitochondrial membrane potentials are expressed as the ratios between fluorescence intensities at 595 nm and 534 nm before and after FCCP treatment and were normalized to the data obtained for parental 293 cells. Data represent means ± standard deviations of three experiments.

