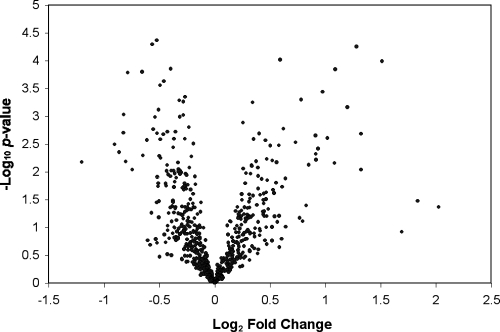
FIG. 1.
Volcano plot of transcriptional differences in M. hyopneumoniae during growth in vivo. Data represent individual gene responses plotted as log2 n-fold changes versus negative log10 P values. Points above the negative log10 P value of 2 are significant at P values of <0.01, with a negative change representing the down-regulated genes and a positive change representing the up-regulated genes.

