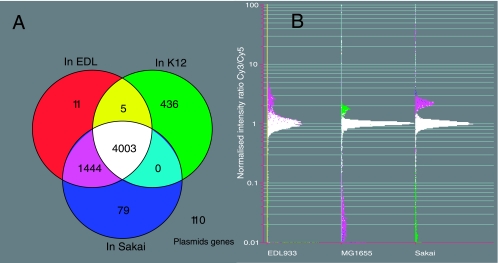
FIG. 1.
(A) Venn diagram to show the distribution of oligonucleotide probes among the three sequenced E. coli strains according to BLASTN results. (B) CGH microarray results, expressed as the normalized log signal intensity ratios between the test (Cy3) and control (Cy5) channels. The data were normalized using positive control genes present in single copy and shared by all three strains.

