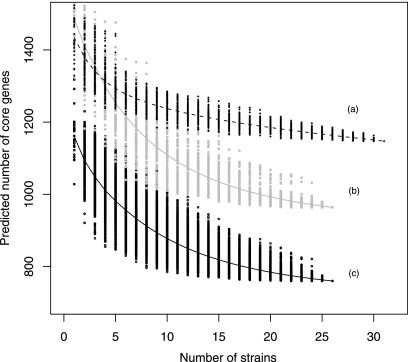
FIG. 7.
Calculation of theoretical core genes by bootstrapping sampling. The data were generated by bootstrapping (5, 10, 11) to determine how the core decreased in size as more strains were included. The points surrounding the predicted lines are the individual bootstrap core sizes. The line of best fit was calculated using a linear model. Line a was calculated based on data from Zhang et al. (44); genes found in MG1655 were excluded. Line b was calculated in the same way as line a but with the data generated in this work. Line c was also generated with data from this work, but genes found in MG1655 and two MG1655-like strains were all excluded.

