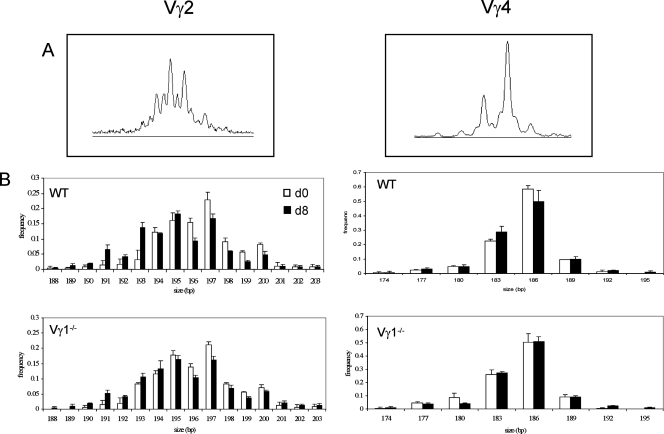
FIG. 2.
Structural analysis of the CDR3 region of TCR-Vγ chains expressed by Listeria-elicited γδ T cells in wild-type and Vγ1−/− mice. (A) TCR CDR3 spectra type analysis of Vγ2 and Vγ4 transcripts expressed in the spleen. (B) Collated profiles for two or more WT and Vγ1−/− mice both before (day 0 [d0]) and 8 days after (d8) Listeria infection (left panels, Vγ2; right panels, Vγ4).

