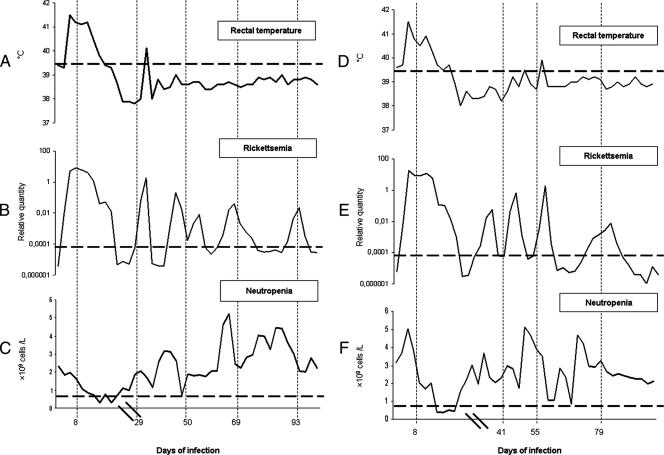
FIG. 1.
Clinical parameters of lambs 4203 and 4210 infected with A. phagocytophilum. (A to F) The rickettsemias in lambs 4203 (B) and lamb 4210 (E), presented as relative quantitative data on a logarithmic graph, showed little association with rectal temperature (A and D) or neutropenia (C and F), except during the first phase of infection. The horizontal dotted lines in panels A and D represent the temperature (39.5°C) above which fever was recorded in this study. The horizontal dotted lines in panels B and E illustrate the threshold level (Ct) for positive rickettsemia (more than 35 cycles by real-time PCR). The horizontal dotted lines in panels C and F represent the value (<0.7 × 10⁹ cells/liter) below which significant neutropenia was recorded in this study. The vertical dotted lines show the sampling times that corresponded to days 8, 29, 50, 69, and 93 postinfection for lamb 4203 or days 8, 41, 55, and 79 postinfection for lamb 4210. Hash marks on the x axis indicate a scale change.

