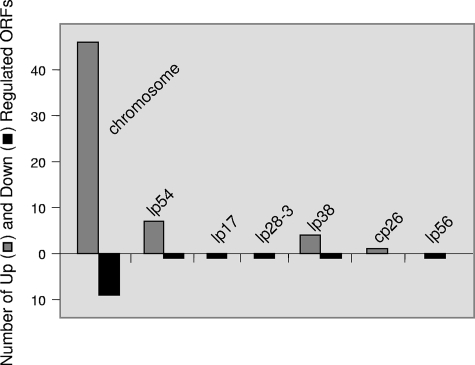
FIG. 2.
Distribution of differentially expressed ORFs among B. burgdorferi replicons after infection of human neuroglial cells in vitro. ORFs (n = 72) included in this graph passed three statistical tests, SAM, partek, and t tests, and were up- or down-regulated at least twofold. The graph displays the number and replicon location of differentially expressed B. burgdorferi genes after infection of H4 neuroglial cells. Gray bars represent the number of up-regulated genes, and the black bars represent the number of down-regulated genes.

