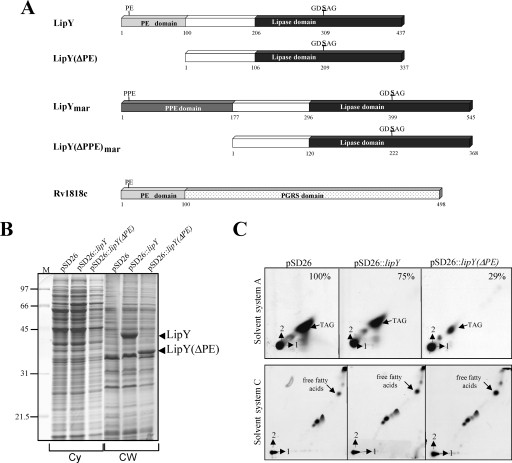
FIG. 1.
Expression of lipY in M. smegmatis and in vivo effect on TAG hydrolysis. (A) Schematic representation of LipY and LipY(ΔPE) from M. tuberculosis, LipYmar and LipY(ΔPPE)mar from M. marinum, and the PE-PGRS protein Rv1818c. The conserved PE and PPE domains are shown in gray, along with the Pro-Glu (PE) and Pro-Glu-Glu (PPE) signatures. The Gly-Ala-rich PGRS domain of Rv1818c is shown as a dot-filled rectangle. The lipase domains of LipY and LipYmar are represented in black, whereas the adjacent domains (100 to 206 in LipY and 177 to 296 in LipYmar) with no homology to known sequences are shown in white. The catalytic lipolytic serine is represented in bold. (B) Mid-log-phase cultures of M. smegmatis carrying either pSD26, pSD26::lipY, or pSD26::lipY(ΔPE) were induced with 0.2% acetamide for 4 h. Cells were harvested and fractionated to separate the cytosol (Cy) from the cell wall (CW). Equal protein amounts (50 μg) were separated by 10% SDS-PAGE. Positions of LipY and LipY(ΔPE) are indicated by arrowheads. M, molecular mass marker. (C) M. smegmatis cultures were grown to mid-log phase and induced with 0.2% acetamide for 4 h prior to labeling with 1 μCi/ml [1,2-14C]acetate for an additional 4 h. Apolar lipids were extracted as described in Materials and Methods. Equal counts (250,000) were applied onto silica gel plates and separated using two different solvent systems: solvent system A, which allows visualization of the TAGs (petroleum ether-ethyl acetate [98:2 {vol/vol}] in the first dimension [×3] and petroleum ether-acetone [98:2 {vol/vol}] in the second dimension), and solvent system C, which allows visualization of free fatty acids (chloroform-methanol [96:4 {vol/vol}] in the first dimension and toluene-acetone [80:20 {vol/vol}] in the second dimension). TLC plates were exposed overnight to film. The percentage of TAGs present in each strain (with regard to the reference strain presence, which was arbitrarily set to 100%) was determined by densitometry and is indicated in the upper right corner of each TLC plate.

