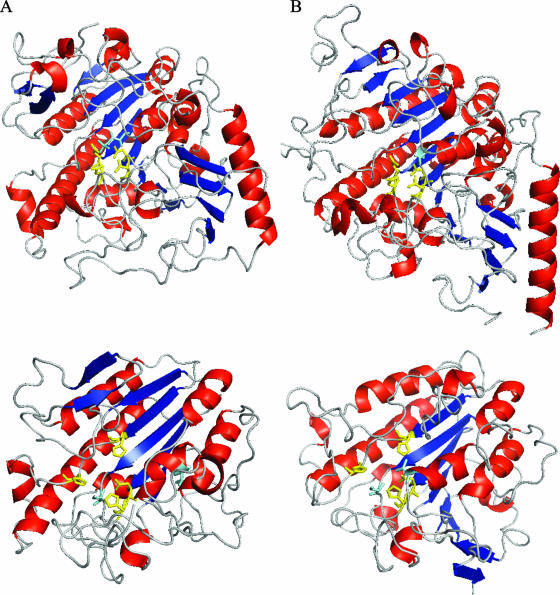
FIG. 7.
Comparative modeling of the catalytic domain of PptA. (A) (Top) Crystallographic structure of human N-acetylgalactosamine-4-sulfatase (residues 43 to 533; Protein Data Bank [PDB] no. 1fsu). (Bottom) Three-dimensional structure of the sulfatase domain of PptA (residues 230 to 540) based on comparative modeling with 1fsu (sequence identity, 15%; E value, 1e-16; model score, 1.00). (B) (Top) Crystallographic structure of human arylsulfatase A (residues 19 to 503; PDB no. 1auk). (Bottom) Three-dimensional structure of the sulfatase domain of PptA (residues 230 to 547) based on comparative modeling with 1auk (sequence identity, 14%; E-value, 6e-42; model score, 0.90). Color coding of the protein backbone is as follows: red, α-helices; blue, β-strands; gray, loop regions. Color coding for residues is as follows: yellow, residues involved in metal ion coordination (human N-acetylgalactosamine-4-sulfatase, D53, D54, D300, and N301; arylsulfatase A, D29, D30, D281, and N282); cyan, active-site residues (human N-acetylgalactosamine-4-sulfatase, C91; arylsulfatase A, C69). Yellow, analogous residues in PptA, i.e., putative residues involved in metal ion coordination (H374, H379, D435, and H436); cyan, putative active-site residues (S241 and T278).

