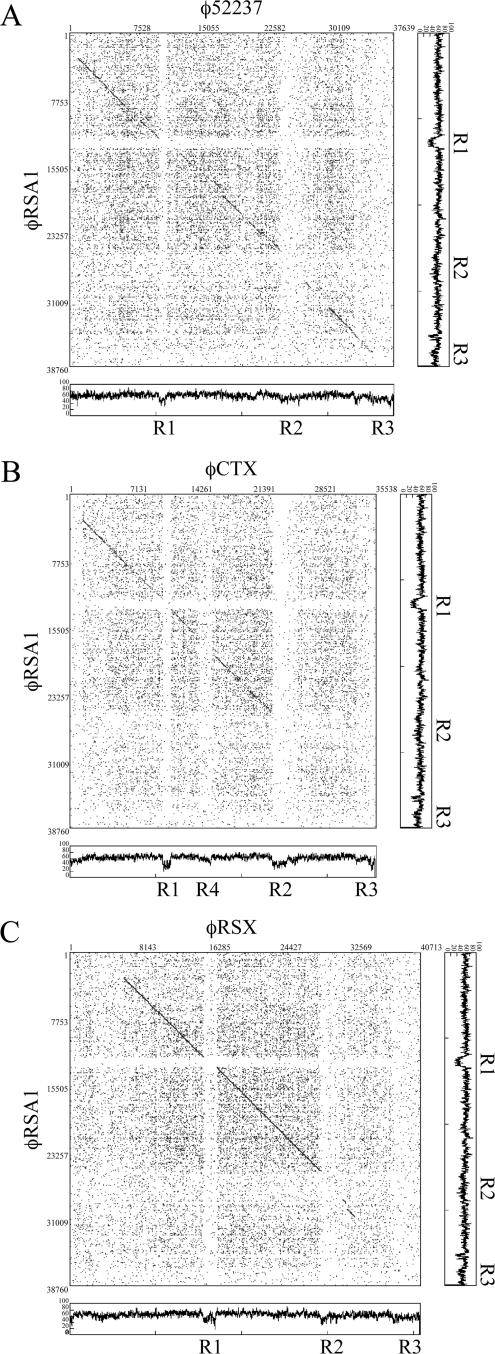
FIG. 2.
Matrix comparison of the genomic nucleotide sequences of φRSA1 and φ52237 (A), φRSA1 and φCTX (B), and φRSA1 and φRSX (C). Nucleotide positions are shown along the genomic sequence. Fifteen matches between 20 nucleotide sequences are marked by dots (DNASIS). The base distribution along the phage genomes (percent G+C, 60-bp windows) are also shown. Regions R1 to R4 are the same as in Fig. 1.

