
FIG. 6.
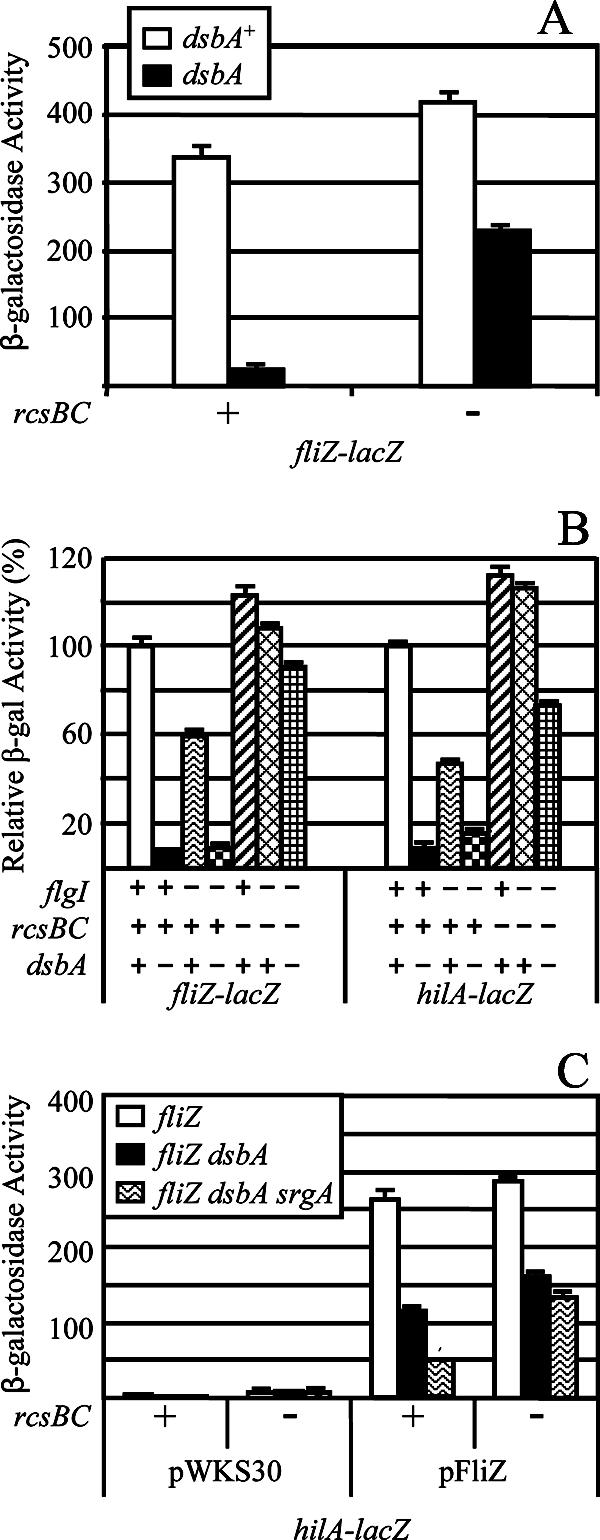
Relationship between fliZ and hilA expression. (A) The strains contained the fliZ-lacZ fusion with the indicated mutations. The strains used were JS696, JS785, JS787, and JS788. (B) The strains contained the lac fusions listed below the graph and flgI, rcsBC, and/or dsbA mutations as indicated. Data are shown as relative β-galactosidase activity where the level of activity of each fusion in a wild-type background is considered 100%. This allows direct comparison of the fusions. The strains used were JS696, JS749, JS754, JS785, JS790 to JS797, JS826, and JS827. (C) The hilA-lacZ fusion strains contained pWKS30 or pFliZ in the indicated backgrounds. The strains used were JS800, JS804, and JS816 to JS825.