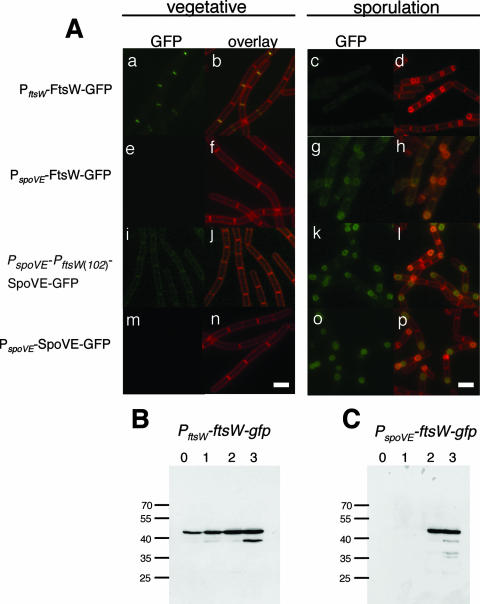
FIG. 2.
Localization of SpoVE-GFP and FtsW-GFP. (A) Strains JDB223 (ftsW::ftsW-gfp; a to d), JDB1755 (spoVE::neo amyE::PspoVE-ftsW-gfp; e to h), JDB1483 (amyE::PspoVE-PftsW(102)-spoVE-gfp; i to l), and JDB1835 (ΔspoVE::tet amyE::PspoVE-spoVE-gfp; m to p) were grown in CH medium and samples were taken before the cells were resuspended at an OD600 of 0.5 (“vegetative”; a, b, e, f, i, j, m, n) or at 3 h of sporulation in A+B medium (“sporulation” [T3]; c, d, g, h, k, l, o, p). The samples were observed by fluorescence microscopy. Cells were labeled with FM4-64 to visualize membranes. The first and third columns show GFP signal; the second and fourth columns show overlay of GFP and membrane signals. Scale bars (white) represent 1 μm. (B, C) Strains JDB223 (ftsW::ftsW-gfp) and JDB1755 (spoVE::neo amyE::PspoVE-ftsW-gfp) were induced to sporulate by resuspension, and samples were collected at the onset of sporulation (0 h) and subsequently at hourly intervals as indicated above the panels. Samples were resolved using a 12% SDS-PAGE gel and subjected to immunoblot analysis with an anti-GFP antibody. Molecular mass markers, in kDa, are on the left of the panels.

