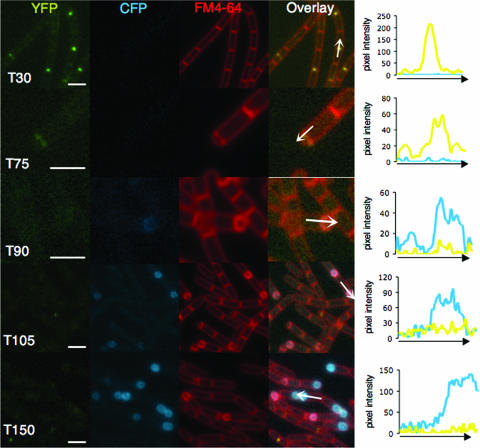
FIG. 3.
Fluorescence microscopy of FtsW and SpoVE. Strain JDB1678 (ftsW-yfp spoVE::neo amyE::spoVE-cfp) was sporulated by resuspension. Time (T) is in minutes. Cells were labeled with FM4-64 to visualize membranes. Consecutive images were acquired using YFP, CFP, and FM4-64 filter sets. The overlay was generated from the YFP, CFP, and FM4-64 images by using the Nikon NIS program. Measurement of pixel intensities was performed by using the Line Scan function of the Nikon NIS program. The values for the CFP and YFP channels are plotted as a function of distance along the arrows shown in the overlays. Note that different scales were used for different samples; scale bars (white) represent 1 μm.

