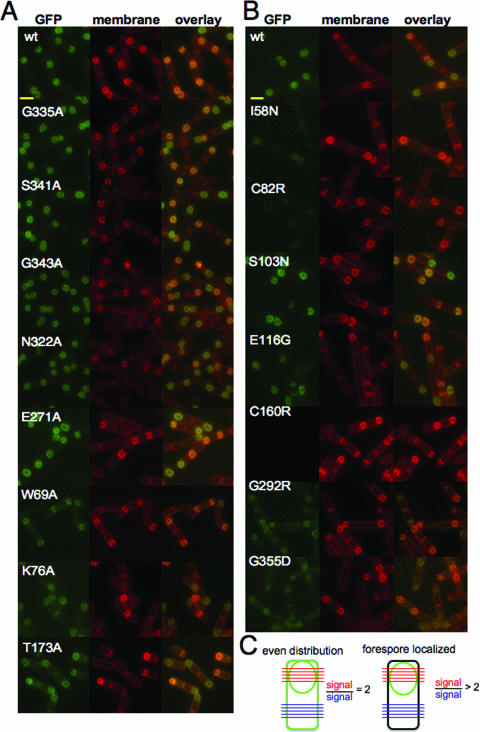
FIG. 5.
Fluorescence microscopy of spoVE point mutants. (A) Strains expressed either wild-type SpoVE-GFP (JDB1835) or SpoVE-GFP mutants generated using site-directed mutagenesis: G335A (JDB1845), S341A (JDB1846), G343A (JDB1847), N322A (JDB1848), E271A (JDB1849), W69A (JDB1850), K76A (JDB1851), and T173A (JDB1852). Scale bars (yellow) represent 1 μm. (B) Strains expressed wild-type SpoVE-YFP (JDB1853) or SpoVE-YFP mutants generated by random mutagenesis: I58N (JDB1854), C82R (JDB1855), S103N (JDB1856), E116G (JDB1857), C160R (JDB1858), G292R (JDB1859), and G355D (JDB1860). (C) We quantified SpoVE localization using ImageJ (NIH [National Institutes of Health]) to measure the average pixel intensity for five lines spanning the forespore (red) and for five lines across the cell at the other end (blue). When the red/blue ratio is 2, then GFP signal is evenly distributed in all membranes (left). When the red/blue ratio is >2, the GFP signal is concentrated at the forespore (right). All strains were sporulated by resuspension, cells were labeled by using FM4-64, and samples for microscopy were obtained at 2.5 h.

