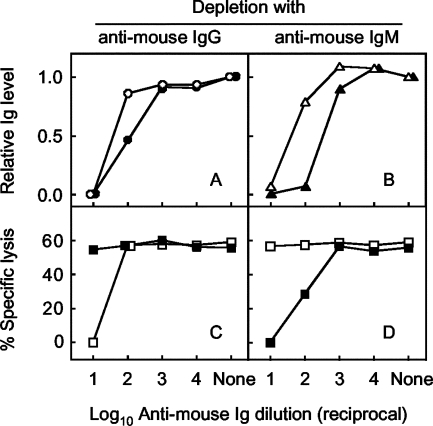
FIG. 7.
Percentages of specific cell lysis obtained with the day-4 serum or HMS depleted of IgG or IgM as determined by the one-dilution method of the CDC assay. Serum was incubated with anti-mouse IgG or IgM and examined for depletion by a sandwich ELISA for measuring IgG (A) or IgM (B) levels and for percentages of specific lysis in sera depleted of IgG (C) or IgM (D). IgG levels obtained from the day-4 serum (closed circles) or HMS (open circles), IgM levels obtained from the day-4 serum (closed triangles) or HMS (open triangles), and percentages of specific lysis obtained from the IgG/IgM-depleted day-4 sera (closed squares) or HMS (open squares) are shown. The abscissa indicates dilutions of anti-mouse IgG or IgM used for depletion. None indicates a control in which sera were incubated with PBS in place of diluted anti-mouse IgG or IgM. The ordinate indicates relative IgG or IgM levels contained in depleted serum as determined by a sandwich ELISA (upper graphs) or percentages of specific lysis obtained with depleted serum by the CDC assay (lower graphs).

