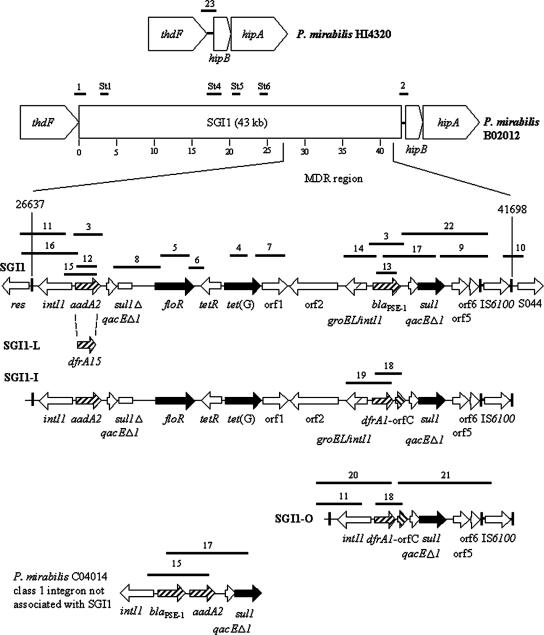
FIG. 2.
Schematic view of the SGI1 and SGI1 variants as integrated in P. mirabilis. The P. mirabilis HI4320 thdF gene and downstream region are shown at the top, and the MDRs of SGI1, SGI1-I, SGI1-L, and SGI1-O (not to scale) are shown at the bottom. Base pair coordinates are from the sequence with accession no. AF261825. PCRs carried out to map the SGI1s are indicated by thick black bars and are numbered (Table 1). SGI1 was mapped as shown, and SGI1-I was mapped as for SGI1 and also with PCRs 18, 19, and 21. The blaPSE-1/aadA2 integron from P. mirabilis C04014 was negative in PCRs 9, 10, 11, and 16.

