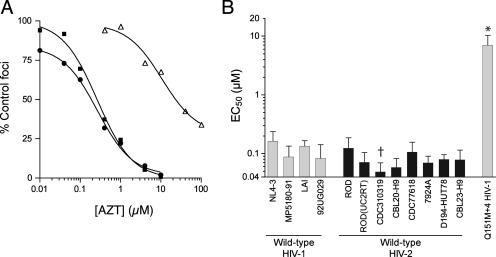
FIG. 1.
AZT sensitivities of wild-type HIV-1 and HIV-2. (A) Representative data from a single dose-response experiment using strains derived from infectious molecular clones. Wild-type HIV-1NL4-3 (filled squares) and wild-type HIV-2ROD (filled circles) were produced from the full-length plasmids pR9ΔApa (23) and pROD9 (7), respectively. The Q151M+4 variant of HIV-1NL4-3 (open triangles) was produced from a mutated version of pR9ΔApa that encoded the Q151M A62V V75I F77L F116Y complex of mutations in RT (23). Data points are the percentages of Lac+ foci in AZT-treated MAGIC-5A cultures relative to those in solvent-only controls. Each point represents the mean of results from three cultures that were maintained in parallel. The curves were generated using a sigmoidal regression equation (GraphPad Prism 4 software). (B) Summary of the wild-type HIV-1 and HIV-2 isolates, as labeled below the abscissa. Bars represent the EC50s of AZT for inhibiting the formation of Lac+ foci in MAGIC-5A cells and are the means ± the standard deviations from three or more independent dose-response experiments. Wild-type HIV-1NL4-3, wild-type HIV-2ROD, and the Q151M+4 variant of HIV-1NL4-3 were produced from molecular clones as described above. HIV-2ROD(UC2RT) was produced from a molecular clone of HIV-2ROD in which the RT-encoding region was replaced with the equivalent region of HIV-2UC2 (see the text for details). The remaining strains were originally isolated from drug-naive patients and were obtained through the National Institutes of Health AIDS Research and Reference Reagent Program (www.aidsreagent.org). †, significantly less than the value for HIV-1NL4-3; *, significantly greater than the values for all wild-type strains (P < 0.05; analysis of variance of log[EC50] values by use of Tukey's multiple-comparison test). The remaining wild-type HIV-1 and HIV-2 isolates were statistically equivalent (P > 0.05).

